- View more resources from this publisher
 Nuffield Foundation
Tooltip
These resources have been reviewed and selected by STEM Learning’s team of education specialists for factual accuracy and relevance to teaching STEM subjects in UK schools.
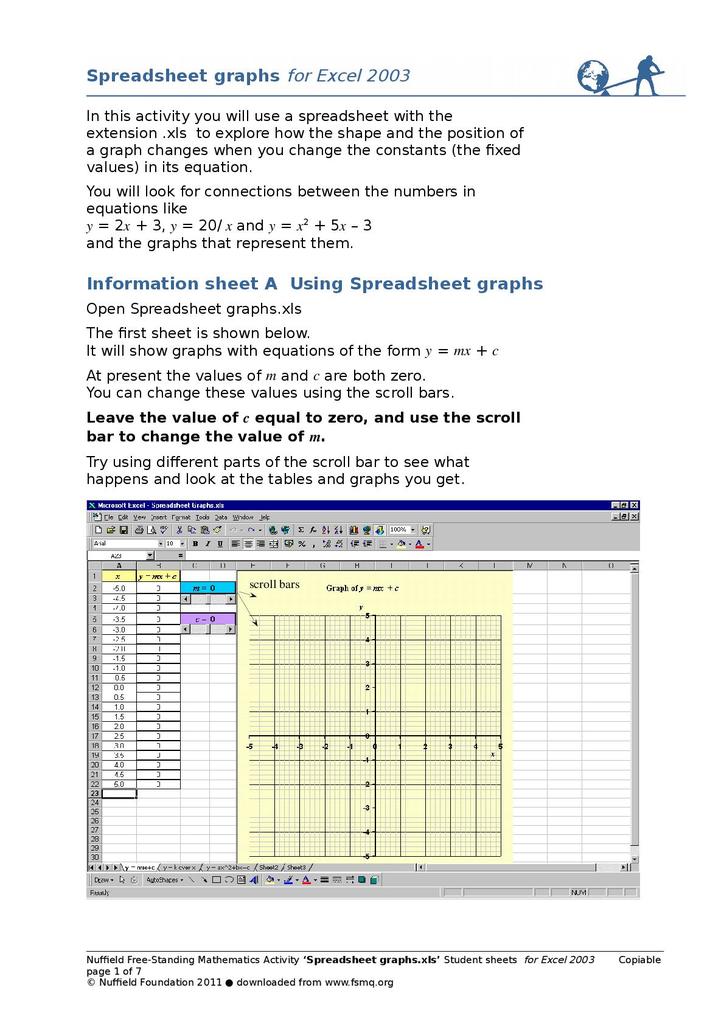
Spreadsheet Graphs
The Nuffield Foundation provide this resource which can be used to introduce the shape and main features of proportional, linear, inverse proportional, and quadratic graphs. Different versions of Excel spreadsheets allow students to explore how the shape and the position of a graph changes when the constants in its equation are altered. Students will look for connections between the numbers in equations like y = 2x + 3, y = 20/ x , y = x2 + 5x – 3 and the graphs that represent them.
Show health and safety information
Please be aware that resources have been published on the website in the form that they were originally supplied. This means that procedures reflect general practice and standards applicable at the time resources were produced and cannot be assumed to be acceptable today. Website users are fully responsible for ensuring that any activity, including practical work, which they carry out is in accordance with current regulations related to health and safety and that an appropriate risk assessment has been carried out.
Downloads
Show downloads
Download all files as a .zip460.85 KB
Information on the permitted use of this resource is covered by the Category Three Content section in STEM Learning’s Terms and conditions.


