Data presentation and interpretation
AS Level
-
interpret diagrams for single-variable data, including understanding that area in a histogram represents frequency
-
Connect to probability distributions
-
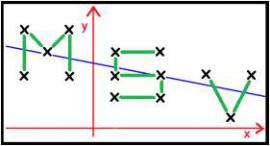
Interpret scatter diagrams and regression lines for bivariate data, including recognition of scatter diagrams which include distinct sections of the population (calculations involving regression lines are excluded)
-
Understand informal interpretation of correlation
-
Understand that correlation does not imply causation
-
Interpret measures of central tendency and variation, extending to standard deviation
-
Be able to calculate standard deviation, including from summary statistics
-
Recognise and interpret possible outliers in data sets and statistical diagrams
-
Select or critique data presentation techniques in the context of a statistical problem
-
Be able to clean data, including dealing with missing data, errors and outlier
Histograms
This series of five interactive excel sheets show the relationship between a grouped frequency table and the histogram. They also deal with class width and frequency density.
Students are invited to interpret the information shown in histograms and explore measures of central tendency in a range of different situations.

Histograms
In this activity students examine real life data, identify skew, and investigate the relationship between mean, median and mode for distributions with varying skew.
Identifying Skew in Histograms: Activity Sheet This handout shows three histograms and five questions relating to each. Students need to interpret the information shown in each histogram and identify how the skewness relates to the three averages. It could be attempted by students after a brief introduction to the topic.
Identifying Skew in Histograms: Teacher Notes This provides an overview of the student handout and makes suggestions about approaches to teaching this topic. It points out that histogram two on the student handout may not be recognised as being symmetrical because students may be looking for near perfect symmetry.

Data Presentation: Histogram Reconstruction
This is an activity designed to enable students to gain a deeper understanding of frequency density and how it is used in the construction of a histogram.
Students cut out bars from a rectangle in order to construct three histograms using the clues given in three partially completed grouped frequency tables and information about the mean, median, modal class or skewness of the histogram.
This resource is part of the Making Stats Vital collection from Jonny Griffiths
Descriptive Statistics
This resource comprises a set of work cards and an excel spreadsheet designed to help students understand:
- Calculating the standard deviation and how it compares to the interquartile range.
- Histograms and how changing class intervals can alter the look of a histogram.
- Construction of boxplots and how outliers can be identified.
The data on the interactive sheets can be altered as either the raw data or the frequencies shown in frequency tables. Self teaching notes and questions are contained on the work cards.
Chapter 4: Using Autograph with CensusAtSchool Data
This resource is a chapter from the booklet Relevant and Engaging Statistics and Data Handling from the Royal Statistical Society Centre for Statistical Education (RSSCSE).
It shows how Autograph can easily transform data from CensusAtSchool into graphs and statistics to analyse easily. It includes histograms, stem and leaf diagrams, lines of best fit and residuals.
Population Data
This is a series of seven lessons that make use of a World Population Data sheet, or can be used with other sources of population data.
Lesson 1 analyses the relationship between birth rates, death rates and population growth, and how all of these tend to vary as a country becomes more developed. Students need to interpret and draw bar charts showing the relative size of different age groups within populations. They also need to draw line graphs.
Lesson 4 explains how the standard deviation is calculated and what it can be used for.
Lesson 5 A possible correlation between birth rate and death rate is sought but not found. The correlation between infant mortality rate and birth rate in a sample of African countries is shown and examples of interpolation given.
Lesson 6 deals with cumulative frequency and comparison of cumulative frequency curves.
Lesson 7 focuses on the construction and use of histograms. Frequency density is explained and students are shown why frequency density is used rather than frequency. The presentation uses histograms, box plots and cumulative frequency curves to compare sets of data.
Standard Deviation
This is a series of interactive excel sheets that explore the different methods for calculating the standard deviation. They deal with discrete data, frequency distributions and finding the standard deviation of a sample.
The methods include summing the squared deviations from the mean and the alternative method of summing the squares of the data instead.
On each sheet the formulae used in each method can be revealed at the side of the page. New examples can be made each time at the click of a button.
Measures of Centre and Spread: Measures of Spread
This PowerPoint presentation is part of the Making Stats Vital collection from Jonny Griffiths.
Students are introduced to the bee academy. A small set of data is provided and members of the bee academy explain how to find the range, the interquartile range, the mean deviation from the mean, the mean squared deviation from the mean, the sample variance and the standard deviation.
Measures of Centre and Spread: Spot the Error
In this Making Stats Vital activity students are presented with a calculation of the standard deviation of race times for seven athletes. Students are asked to comment upon the result which is too large for the given data. Can students spot the error?
The teachers' notes highlight the errors produced by rounding during a calculation.
Correlation
The first sheet of this excel file shows a set of data in a scatter plot. The line of best fit can be drawn and a description of the type of correlation can be revealed along with the equation of the trend line.
The other sheet shows the value of cars at various ages. The scatter plot shows the data and there are a few questions to be answered about the correlation and based on the use of the line of best fit.
There are three more sheets of questions which may be suitable for use in the classroom.
Representing Data
Produced by the Learning and Skills Improvement Service (LSIS), this collection of eight resources includes material that covers correlation and scattergrpahs, as well as Histograms.
The resources include active learning materials suitable for small groups or as a series of lesson starter activities.