- View more resources from this publisher
 Association for Science Education (ASE)
Tooltip
These resources have been reviewed and selected by STEM Learning’s team of education specialists for factual accuracy and relevance to teaching STEM subjects in UK schools.
Air Quality
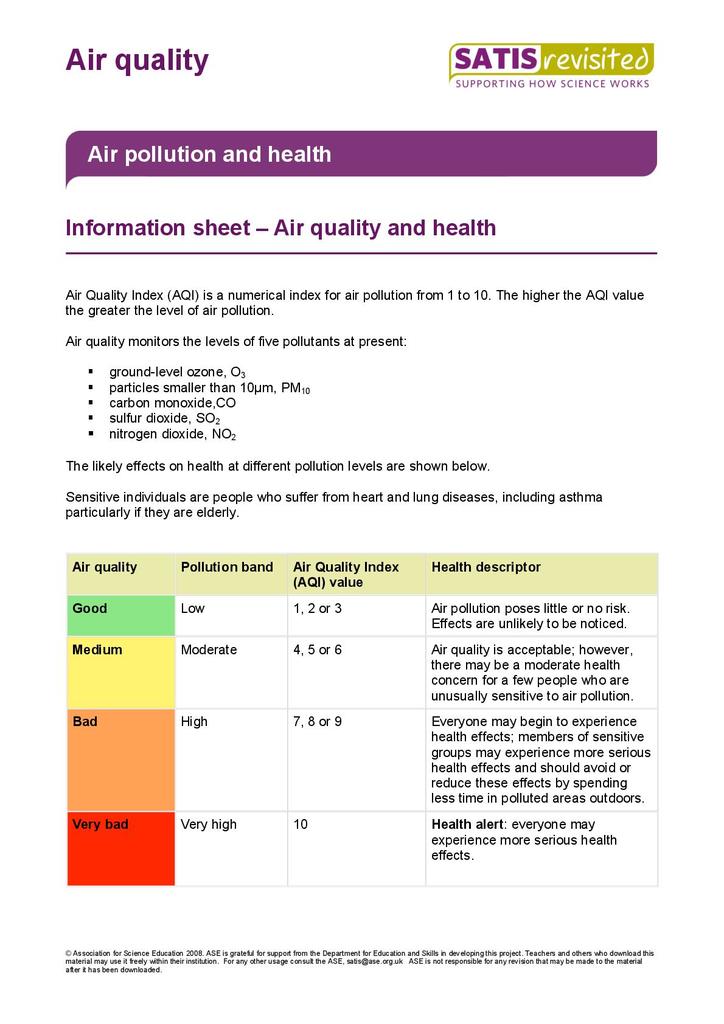
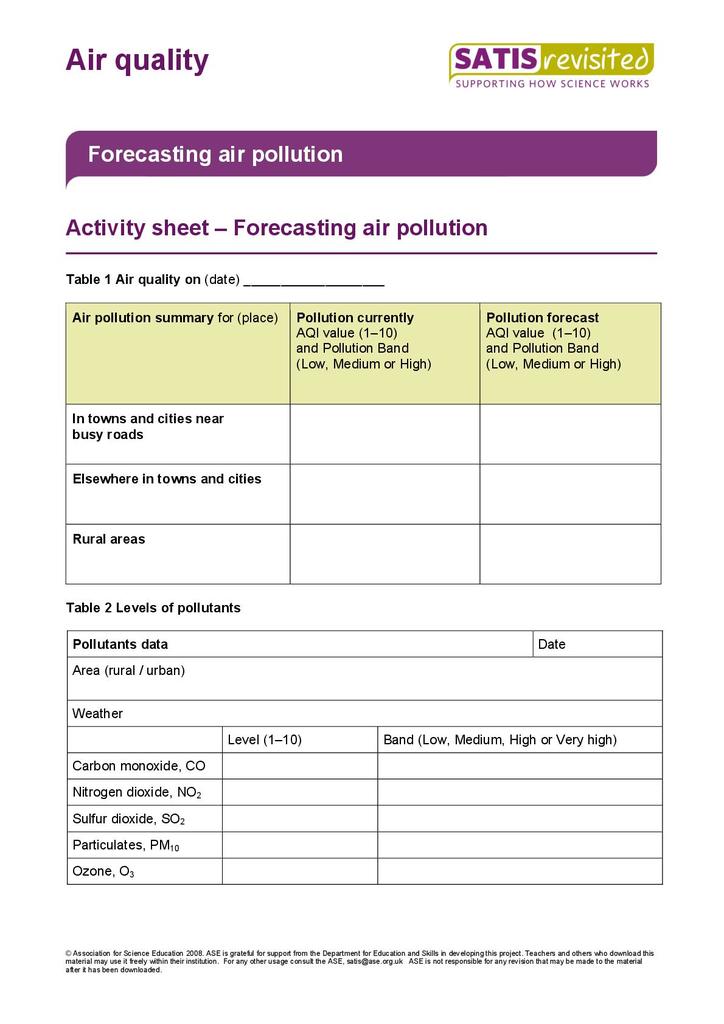
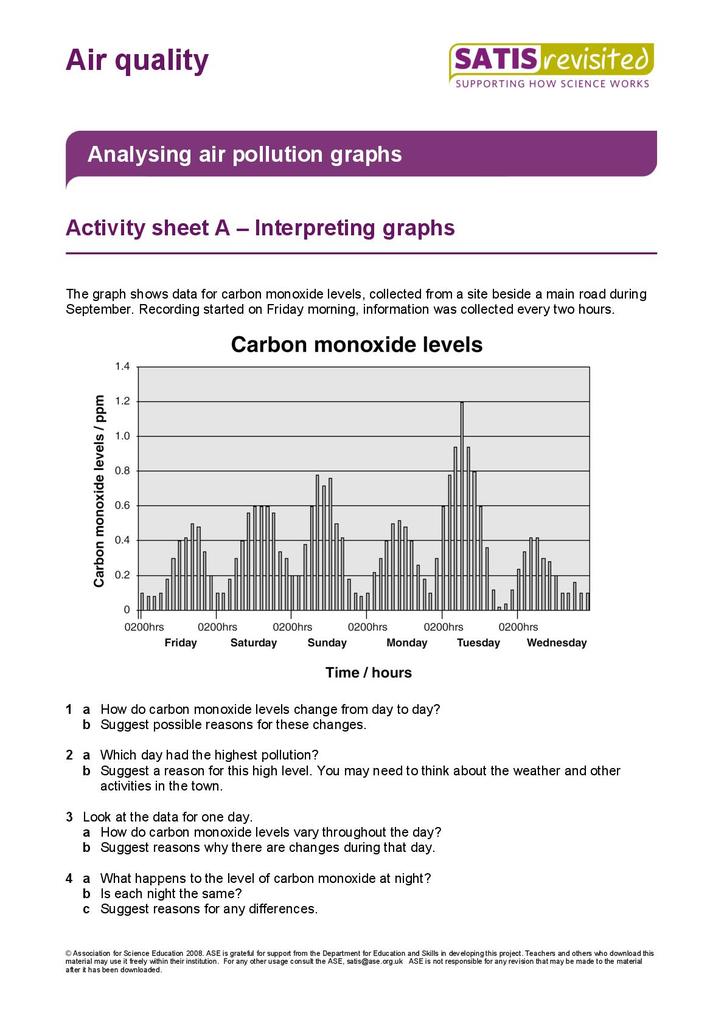
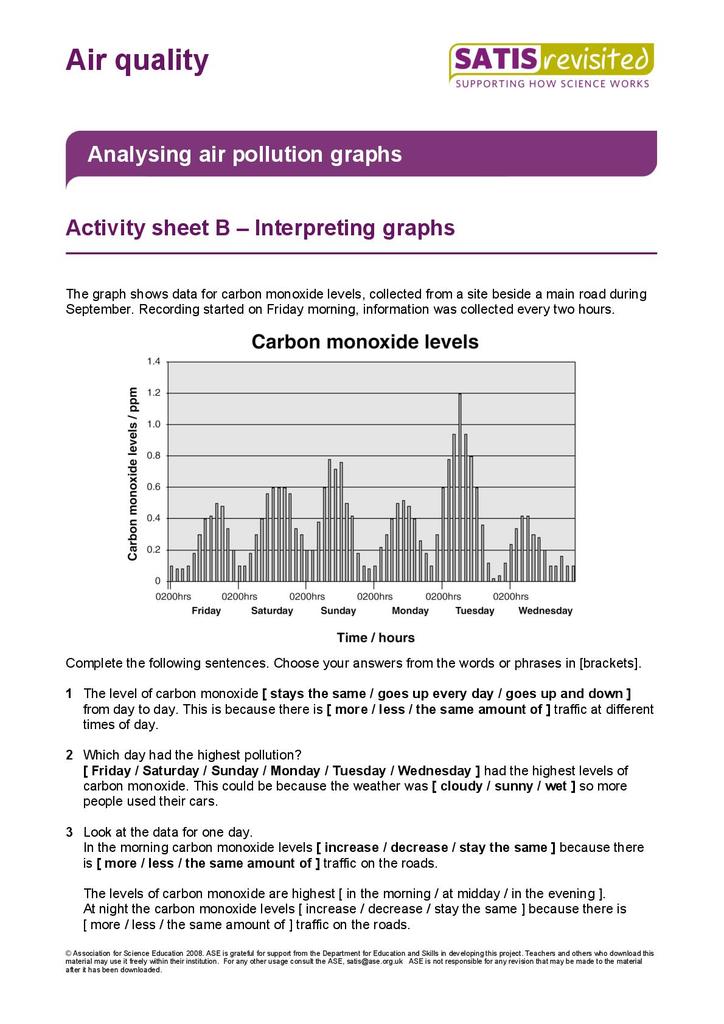
Air pollutants arise from natural processes and human activities. In this SATIS Revisited resource, students investigate air pollution, how it is monitored and some effects on human health. Air pollutants arise from a wide variety of sources, although they are mainly a result of the combustion process. It is easy to assume that most of these air pollutants arise as a result of human activity, but large amounts are also produced by natural processes such as forest fires, volcanoes and bacteria. The largest sources of pollutants produced by human activities include motor vehicles and industry. Motor vehicles emit a wide variety of pollutants, principally carbon monoxide (CO), oxides of nitrogen (NOx), volatile organic compounds (VOCs) and particulates (PM10). In addition, photochemical reactions resulting from the action of sunlight on nitrogen dioxide (NO2) and VOCs from vehicles lead to the formation of ozone, a secondary long-range pollutant, which impacts in rural areas often far from the original emission site. The activities look at air pollution and how it is monitored. Pupils can collect data for their own area and analyse it in terms of the levels of air pollution and the effect on human health. Contents of this unit: Unit overview Presentation Guidance for teachers Air pollution: *Fact file blanks (make several copies and cut in half) *Information sheet – Air pollution – where does it come from? *Activity sheet A – Air pollution – where does it come from? *Activity sheet B – Air pollution – where does it come from? (simplified version) Air pollution and health: *Information sheet – Air quality and health *Activity sheet A – Air pollution and health *Activity sheet B – Air pollution and health (simplified version) *Fact file blanks (if not used in the first activity) (optional) Forecasting air pollution: *Activity sheet – Forecasting air pollution Analysing air pollution graphs: *Excel spreadsheet with carbon monoxide data (optional) *Activity sheet A – Interpreting graphs *Activity sheet B – Interpreting graphs (simplified version)
Show health and safety information
Please be aware that resources have been published on the website in the form that they were originally supplied. This means that procedures reflect general practice and standards applicable at the time resources were produced and cannot be assumed to be acceptable today. Website users are fully responsible for ensuring that any activity, including practical work, which they carry out is in accordance with current regulations related to health and safety and that an appropriate risk assessment has been carried out.
Downloads
-
Overview 573.02 KB
-
Presentation 2.11 MB
-
Guidance for teachers 985.84 KB
-
Fact file blanks 120.49 KB
-
Air pollution (information sheet) 147.58 KB
-
Air pollution (activity sheet) 137.44 KB
-
Air pollution (simplified version) 420.54 KB
-
Forecasting air pollution 142.48 KB
-
Interpreting air pollution graphs A 184.46 KB
Show downloads
-
 Overview 573.02 KB
 -
Presentation 2.11 MB
-
Guidance for teachers 985.84 KB
-
Fact file blanks 120.49 KB
-
Air pollution (information sheet) 147.58 KB
-
Air pollution (activity sheet) 137.44 KB
-
Air pollution (simplified version) 420.54 KB
-
-
-
-
Forecasting air pollution 142.48 KB
-

-
Interpreting air pollution graphs A 184.46 KB
-
Download all files as a .zip5.17 MB
Information on the permitted use of this resource is covered by the Category Three Content section in STEM Learning’s Terms and conditions.


