- View more resources from this publisher
 Gatsby Science Enhancement Programme
Tooltip
These resources have been reviewed and selected by STEM Learning’s team of education specialists for factual accuracy and relevance to teaching STEM subjects in UK schools.
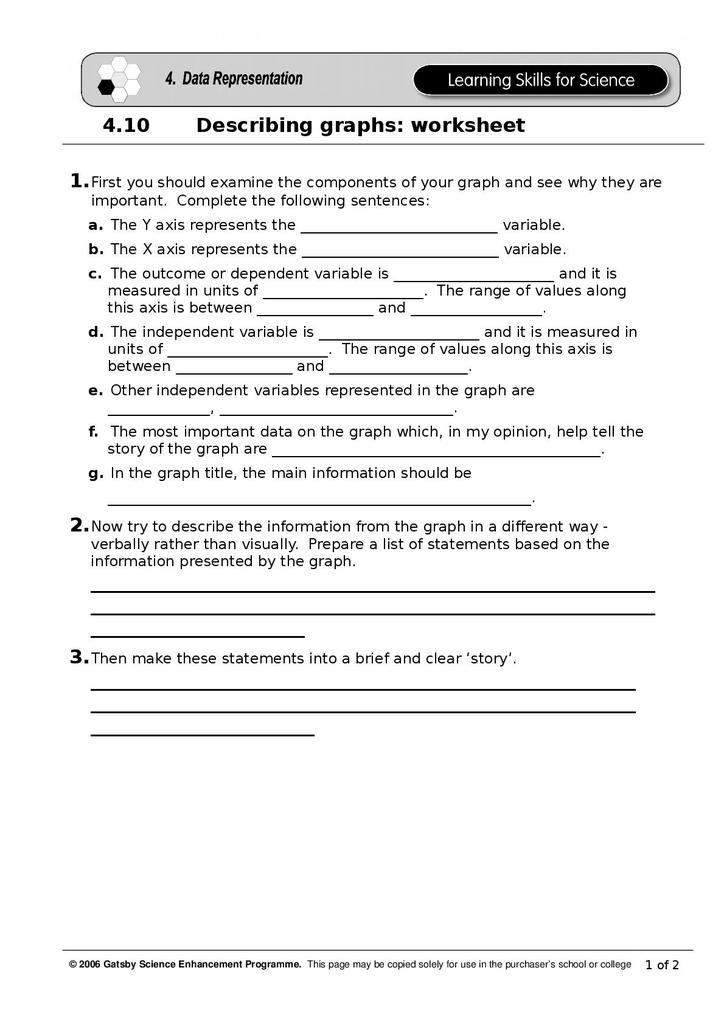
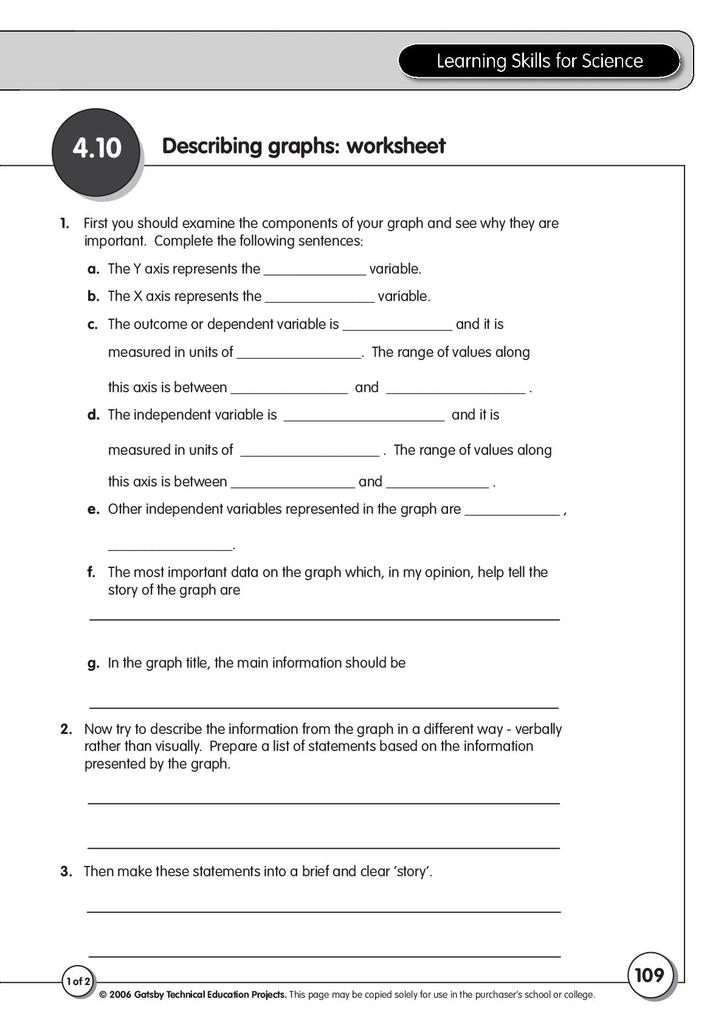
Skill 4.10 Describing Graphs
These activities, produced by Gatsby Science Enhancement Programme, have students write down what they have learned and understood from a graph about life expectancy and mortality. First in the form of statements and then in a narrative form. Students then move on to look at the different components of the graph, such as the labels, axes and scale.
Additional graphs are also provided on subjects that include fertilisers and plant growth, atmospheric carbon dioxide concentrations, energy consumption, leukaemia, reaction times, vehicle fuel consumption and food intake.
Show health and safety information
Please be aware that resources have been published on the website in the form that they were originally supplied. This means that procedures reflect general practice and standards applicable at the time resources were produced and cannot be assumed to be acceptable today. Website users are fully responsible for ensuring that any activity, including practical work, which they carry out is in accordance with current regulations related to health and safety and that an appropriate risk assessment has been carried out.
Downloads
-
Data representation (teachers' guide) 966.38 KB
-
Activity 4.10 (Word) 726.5 KB
-
Activity 4.10 (PDF) 330.44 KB
-
Additional graphs 4.01 MB
Show downloads
-
 Data representation (teachers' guide) 966.38 KB
 -
 Activity 4.10 (Word) 726.5 KB
 -
Activity 4.10 (PDF) 330.44 KB
-
Additional graphs 4.01 MB
Download all files as a .zip5.56 MB
Information on the permitted use of this resource is covered by the Category Three Content section in STEM Learning’s Terms and conditions.


