- View more resources from this publisher
 Nuffield Foundation
Tooltip
These resources have been reviewed and selected by STEM Learning’s team of education specialists for factual accuracy and relevance to teaching STEM subjects in UK schools.
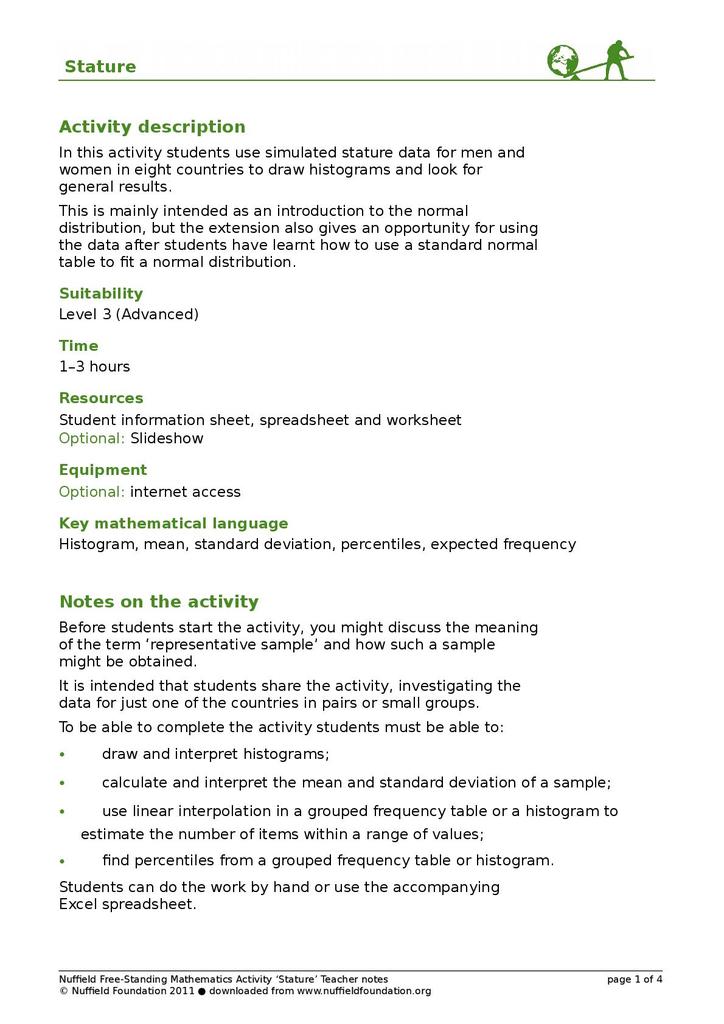
Stature
The Nuffield Foundation provide this resource where students use simulated stature data for men and women in eight countries to draw histograms and look for general results, as manufacturers need to take these into account when they design products. This is mainly intended as an introduction to the normal distribution, but the extension also gives an opportunity for using the data after students have learnt how to use a standard normal table to fit a normal distribution. To be able to complete the activity students must be able to: *draw and interpret histograms *calculate and interpret the mean and standard deviation of a sample *use linear interpolation in a grouped frequency table or a histogram to estimate the number of items within a range of values *find percentiles from a grouped frequency table or histogram
Show health and safety information
Please be aware that resources have been published on the website in the form that they were originally supplied. This means that procedures reflect general practice and standards applicable at the time resources were produced and cannot be assumed to be acceptable today. Website users are fully responsible for ensuring that any activity, including practical work, which they carry out is in accordance with current regulations related to health and safety and that an appropriate risk assessment has been carried out.
Downloads
-
Stature (activity sheet) 171.33 KB
-
Stature (teachers' notes) 141.08 KB
-
Stature (data set) 53.5 KB
-
Stature 870.33 KB
Show downloads
-
 Stature (activity sheet) 171.33 KB
 -
Stature (teachers' notes) 141.08 KB
-
 Stature (data set) 53.5 KB
 -
 Stature 870.33 KB
Download all files as a .zip718.53 KB
Information on the permitted use of this resource is covered by the Category Three Content section in STEM Learning’s Terms and conditions.


