- View more resources from this publisher
 Core Maths
Tooltip
These resources have been reviewed and selected by STEM Learning’s team of education specialists for factual accuracy and relevance to teaching STEM subjects in UK schools.
Body temperature
This Core Maths task asks the question ‘How do you know if you are really unwell?’ The activity explores the data surrounding body temperature, shows how to summarise continuous data and explores the effect on summary statistics that changing the size of the class interval has.
Body temperature: Teacher guidance
This detailed teacher guidance gives a step-by-step on how best to approach each part of the activity, including what questions to ask to prompt discussion.
Body temperature: presentation
This PowerPoint presentation introduces the activity and includes data sets, calculations, graphs and charts for the data.
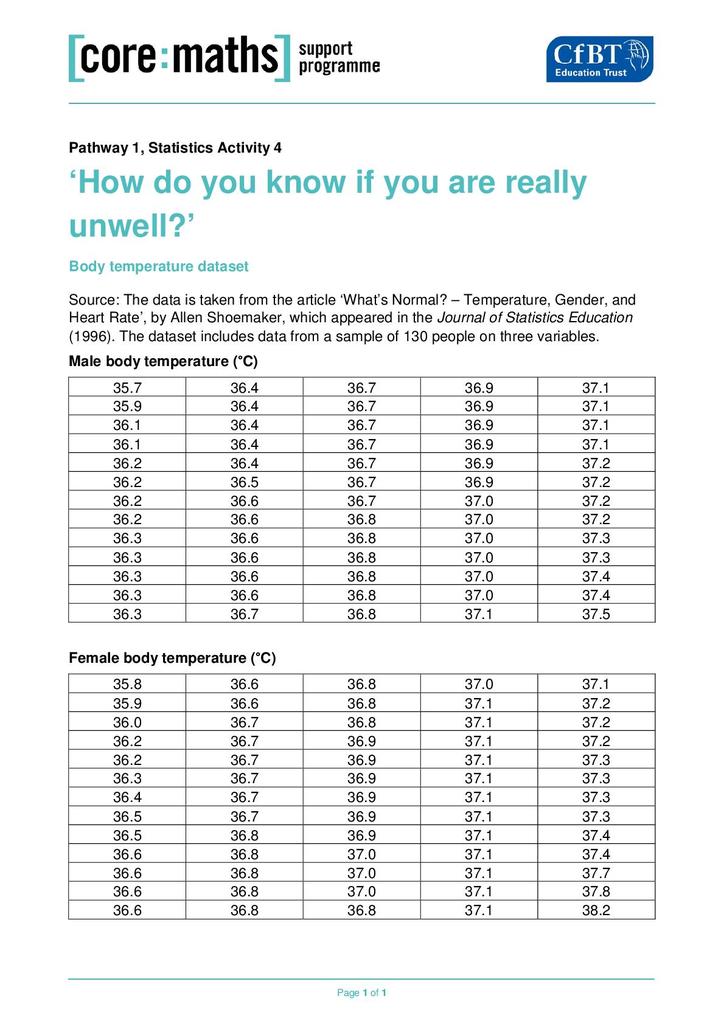
Body temperature: data
This student handout includes data taken from the article ‘What’s Normal? – Temperature, Gender, and Heart Rate’, by Allen Shoemaker, which appeared in the Journal of Statistics Education (1996). The dataset includes data from a sample of 130 people.
Show health and safety information
Please be aware that resources have been published on the website in the form that they were originally supplied. This means that procedures reflect general practice and standards applicable at the time resources were produced and cannot be assumed to be acceptable today. Website users are fully responsible for ensuring that any activity, including practical work, which they carry out is in accordance with current regulations related to health and safety and that an appropriate risk assessment has been carried out.
Downloads
-
Body temperature (presentation) 3.89 MB
-
Body temperature: data (worksheet) 213.21 KB
Show downloads
-

-

-
 Body temperature (presentation) 3.89 MB
 -
Body temperature: data (worksheet) 213.21 KB
-
Download all files as a .zip8.65 MB
Information on the permitted use of this resource is covered by the Category Three Content section in STEM Learning’s Terms and conditions.


